In today’s digital landscape, data analytics plays a crucial role in optimizing the performance of banner ads. With the vast amount of data available, advertisers can track key metrics, analyze user behavior, and make informed decisions that lead to more effective campaigns. This guide will explore how to use data analytics to enhance your banner ad performance and maximize your return on investment (ROI).
1. Understanding the Importance of Data Analytics in Banner Advertising
1.1 The Role of Data in Modern Advertising
Data analytics provides insights that help advertisers understand how their banner ads are performing, what’s working, and what needs improvement.
- Informed Decision-Making: By analyzing data, advertisers can make evidence-based decisions that enhance the effectiveness of their ads.
- Targeted Campaigns: Data allows for more precise targeting, ensuring that ads are shown to the right audience at the right time, which improves engagement and conversion rates.

How to Use Data Analytics to Improve Banner Ad Performance
1.2 Key Metrics to Track
To effectively use data analytics, it’s essential to track the right metrics that indicate the performance of your banner ads.
- Click-Through Rate (CTR): CTR measures the percentage of users who click on your ad. A high CTR indicates that your ad is engaging and relevant to your audience.
- Conversion Rate: This metric tracks how many users take a desired action (e.g., making a purchase) after clicking on your ad. It’s a key indicator of your ad’s effectiveness in driving results.
- Cost Per Click (CPC) and Cost Per Acquisition (CPA): These metrics help you understand the cost-effectiveness of your campaign by showing how much you’re spending to get clicks and conversions.
- Bounce Rate: Bounce rate measures the percentage of users who click on your ad but leave the landing page without interacting further. A high bounce rate may indicate that the landing page isn’t aligned with the ad’s message.
2. Leveraging Data to Optimize Banner Ads
2.1 A/B Testing for Continuous Improvement
A/B testing is a powerful technique that allows you to compare different versions of your banner ads to determine which performs better.
- Test Different Elements: Experiment with various elements of your ads, such as headlines, images, calls-to-action (CTAs), and colors. Analyzing the results will help you identify the most effective combinations.
- Analyze Results: Use data from A/B tests to understand which variations resonate most with your audience, leading to improved ad performance.
2.2 Audience Segmentation
Data analytics enables you to segment your audience and create tailored ads that speak directly to specific groups.
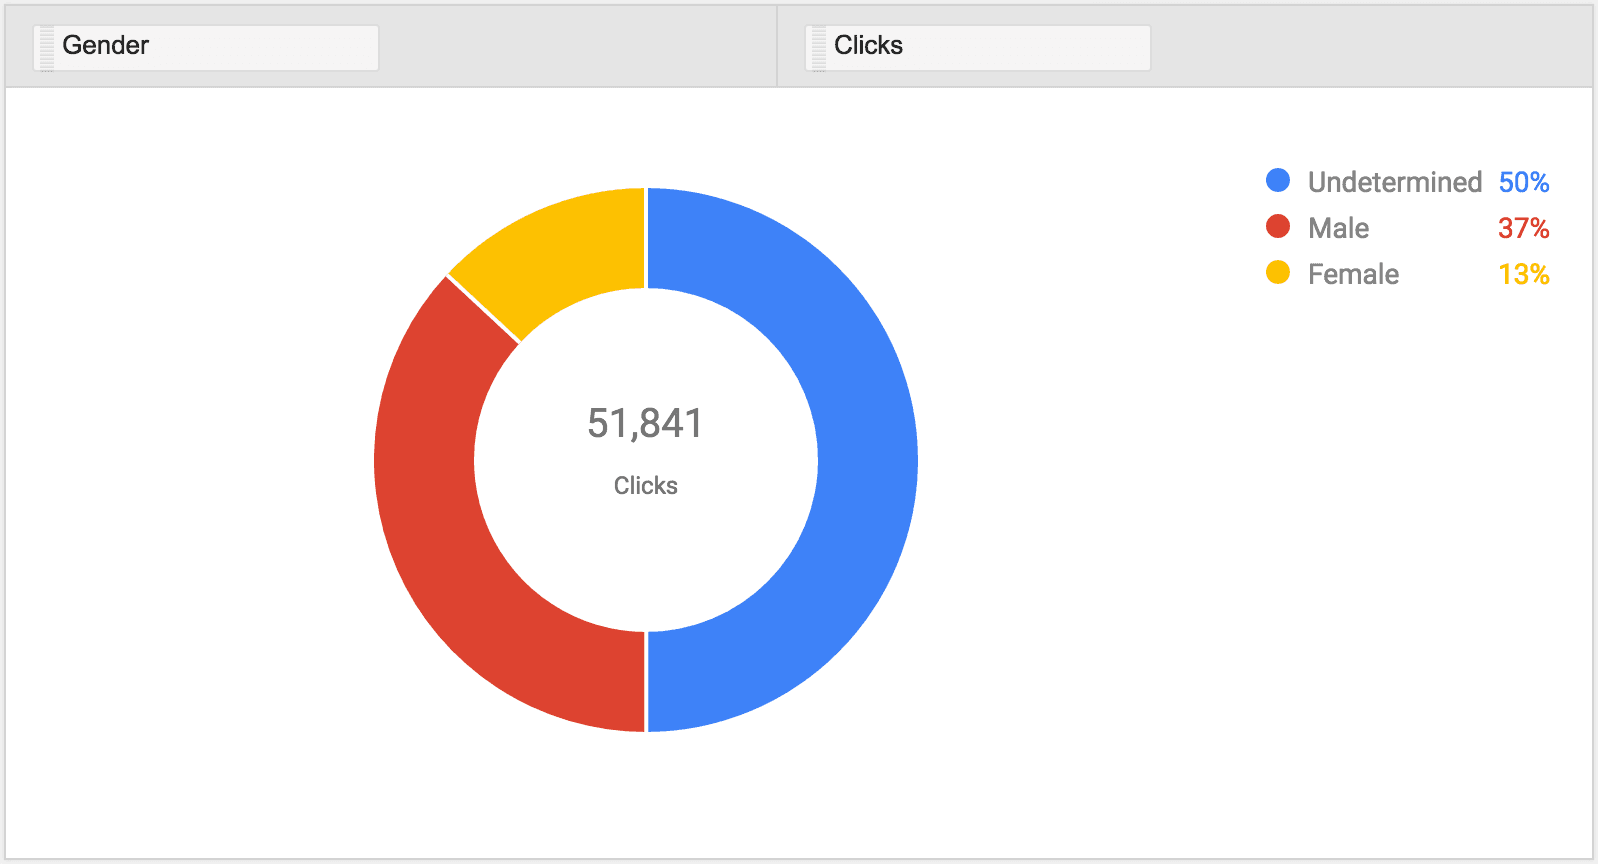
- Demographic Segmentation: Divide your audience based on age, gender, income, and other demographic factors. This allows you to create ads that appeal to different segments more effectively.
- Behavioral Segmentation: Analyze user behavior data, such as past purchases or browsing history, to target ads more precisely. This approach increases the likelihood of conversions by showing relevant ads to interested users.
2.3 Real-Time Optimization
Real-time data analytics allows you to adjust your banner ad campaigns on the fly, ensuring that you can respond to performance trends as they happen.
- Dynamic Creative Optimization (DCO): Use DCO to automatically adjust ad content based on real-time data, such as user location or device. This ensures that your ads remain relevant and engaging.
- Bid Adjustments: If you’re running a programmatic ad campaign, use real-time data to adjust your bids based on factors like time of day, user behavior, or competition. This helps you maximize your ad spend by focusing on the most promising opportunities.
3. Improving Banner Ad Design Through Data
3.1 Heatmaps and User Interaction Data
Heatmaps and user interaction data provide insights into how users engage with your banner ads.
- Analyze Click Patterns: Heatmaps show where users are clicking on your ads, helping you understand which elements are attracting attention and which are being ignored.
- Optimize Layout: Use interaction data to refine the design of your ads, placing the most critical elements, such as CTAs, in areas where they are most likely to be noticed.
3.2 Feedback Loops for Continuous Improvement
Implement feedback loops to continually refine your banner ads based on data insights.
- User Feedback: Collect user feedback on your ads, whether through surveys, comments, or direct interactions. This qualitative data can complement your quantitative analytics and provide deeper insights.
- Iterative Design: Use the data and feedback you gather to make iterative improvements to your ads. Regularly updating and refining your creative based on performance data will help you stay ahead of ad fatigue and keep your campaigns fresh.
4. Measuring the ROI of Your Banner Ad Campaigns
4.1 Calculating ROI
To determine the success of your banner ad campaigns, it’s essential to calculate the ROI.
- Track Revenue: Measure the revenue generated from your banner ads by tracking conversions and attributing sales or leads to specific campaigns.
- Compare Costs: Subtract the total costs of your campaign, including ad spend, design, and management, from the revenue generated. Divide this number by the total cost to calculate your ROI.
4.2 Long-Term Value Analysis
Consider the long-term value (LTV) of customers acquired through banner ads.
- Customer Retention: Analyze the retention rates of customers who first engaged with your brand through a banner ad. High retention rates indicate that your ads are attracting loyal customers.
- Lifetime Value: Calculate the LTV of customers acquired through banner ads to understand the long-term profitability of your campaigns.
Conclusion
Data analytics is a powerful tool for improving the performance of your banner ads. By tracking key metrics, leveraging A/B testing, segmenting your audience, and optimizing in real-time, you can create more effective ads that resonate with your audience and drive better results. Additionally, using data to refine your ad design and measuring ROI will help you maximize the impact of your digital advertising efforts. Embrace data-driven strategies to ensure that your banner ad campaigns are not only engaging but also profitable.
