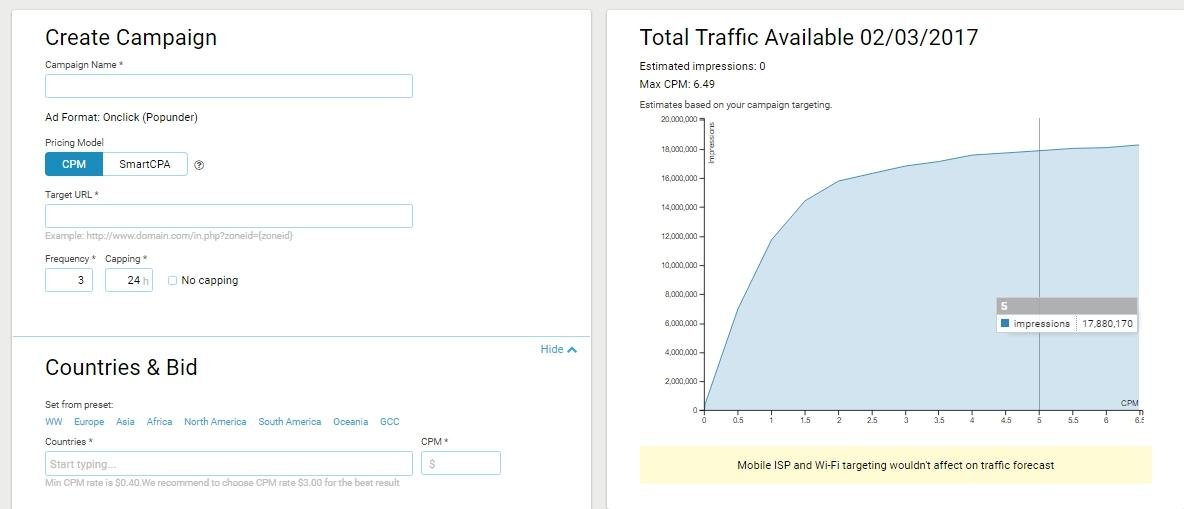
Measuring the effectiveness of pop under ads is crucial for understanding their impact and optimizing your advertising strategy. Unlike more direct ad formats, pop under ads appear beneath the user’s active window and become visible only when the window is closed or minimized. This unique nature requires a specific approach to evaluation. This guide explores the key metrics and methods for measuring the effectiveness of pop under ads.
Key Metrics to Evaluate Pop Under Ads
**1. Click-Through Rate (CTR)
Definition: Click-through rate measures the percentage of users who click on your pop under ad compared to the total number of times the ad was displayed.
- Formula: CTR=Number of ClicksNumber of Impressions×100\text{CTR} = \frac{\text{Number of Clicks}}{\text{Number of Impressions}} \times 100
- Significance: A higher CTR indicates that your ad is effectively capturing user interest and prompting engagement.
**2. Conversion Rate
Definition: Conversion rate measures the percentage of users who take a desired action after interacting with your pop under ad.
- Formula: Conversion Rate=Number of ConversionsNumber of Clicks×100\text{Conversion Rate} = \frac{\text{Number of Conversions}}{\text{Number of Clicks}} \times 100
- Significance: This metric helps assess how well your pop under ad drives users to complete a goal, such as signing up for a newsletter or making a purchase.
How to Measure the Effectiveness of Pop Under Ads
**3. Cost Per Acquisition (CPA)
Definition: Cost per acquisition calculates the average cost of acquiring a new lead or customer through your pop under ads.
- Formula: CPA=Total Ad SpendNumber of Acquisitions\text{CPA} = \frac{\text{Total Ad Spend}}{\text{Number of Acquisitions}}
- Significance: A lower CPA indicates that your ads are efficiently generating leads or customers at a reasonable cost.
**4. Return on Investment (ROI)
Definition: ROI measures the profitability of your pop under ad campaign relative to its cost.
- Formula: ROI=Revenue from AdTotal Ad Spend×100\text{ROI} = \frac{\text{Revenue from Ad}}{\text{Total Ad Spend}} \times 100
- Significance: A positive ROI demonstrates that your ad campaign is generating more revenue than it costs, reflecting its overall effectiveness.
**5. User Engagement
Definition: User engagement tracks how users interact with your pop under ad and its subsequent impact.
- Metrics to Track:
- Time Spent on Ad: Measures how long users engage with the ad content.
- Interactions: Includes any actions taken by users, such as scrolling or clicking on interactive elements.
- Significance: Higher engagement indicates that your ad content is compelling and resonates with users.
Analytical Techniques for Evaluating Pop Under Ads
**1. A/B Testing
Definition: A/B testing involves comparing two versions of your pop under ad to determine which performs better.
- How to Implement:
- Create Variations: Develop different versions of your ad with varying elements, such as design, copy, or call-to-action.
- Test and Compare: Run both versions simultaneously and analyze performance metrics to identify the most effective ad.
- Benefits: A/B testing helps optimize ad elements and improve overall effectiveness based on real user data.
**2. Analytics Tools
Definition: Utilize analytics tools to track and analyze ad performance data.
- Recommended Tools:
- Google Analytics: For tracking user behavior, conversions, and ad performance.
- Ad Network Analytics: Many ad networks provide built-in analytics for tracking metrics specific to pop under ads.
- Benefits: These tools provide detailed insights into how your ads are performing and help make data-driven decisions.
**3. Heatmaps and User Recording
Definition: Heatmaps and user recording tools provide visual insights into user interactions with your pop under ads.
- How to Use:
- Heatmaps: Visualize where users click, hover, or scroll on your ad.
- User Recordings: Watch recordings of user sessions to understand their interactions and behavior.
- Benefits: These tools offer in-depth insights into user engagement and help identify areas for improvement.
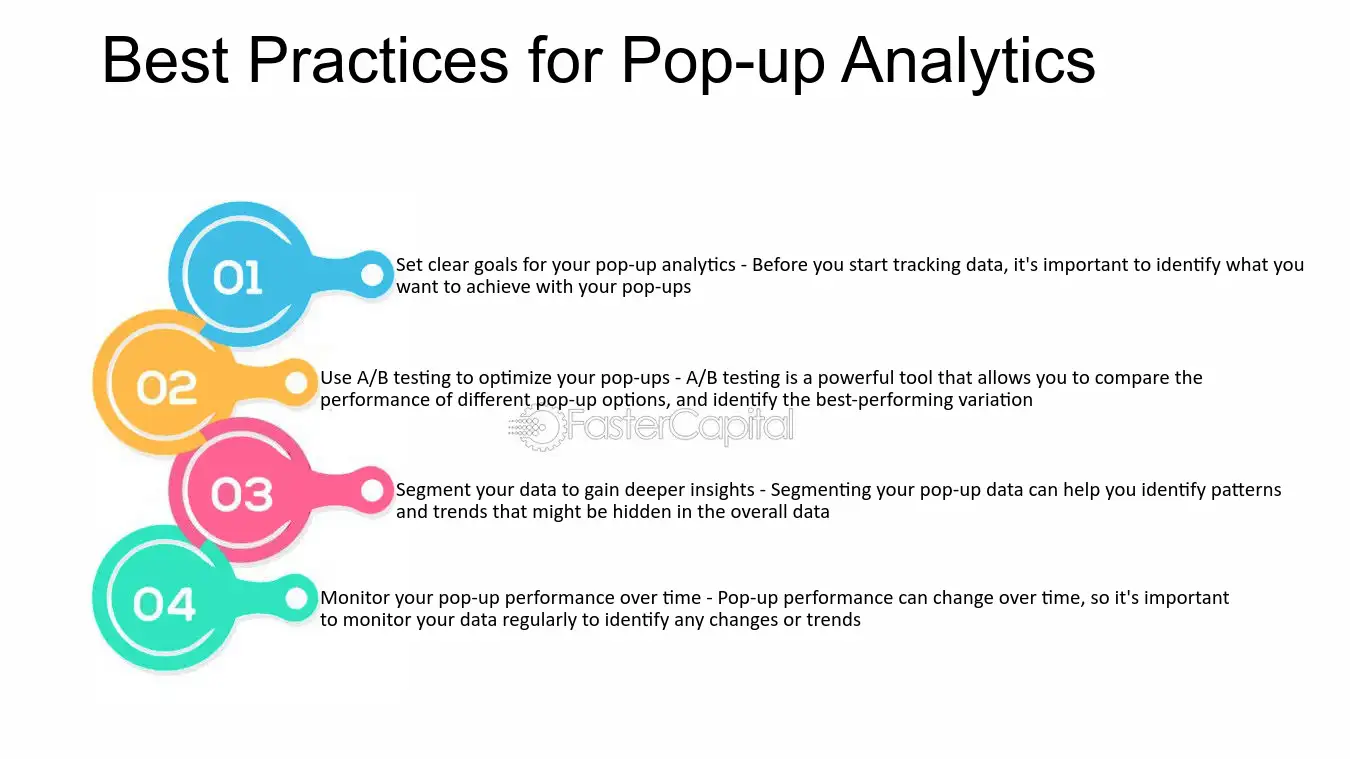
Best Practices for Optimizing Pop Under Ads
**1. Refine Ad Targeting
- Use Data-Driven Targeting: Apply targeting based on user demographics, interests, and behavior to reach a relevant audience.
- Adjust Based on Performance: Regularly review targeting data and make adjustments to improve ad effectiveness.
**2. Enhance Ad Design
- Improve Visual Appeal: Ensure your ad design is eye-catching and aligns with your brand.
- Optimize Messaging: Craft clear and compelling messages that encourage user engagement and conversions.
**3. Monitor and Adjust
- Regular Performance Reviews: Continuously monitor performance metrics and make adjustments as needed.
- Adapt Strategies: Use insights from performance data to refine your ad strategy and enhance overall effectiveness.
Conclusion
Measuring the effectiveness of pop under ads involves evaluating key metrics such as click-through rate, conversion rate, cost per acquisition, return on investment, and user engagement. By utilizing analytical techniques like A/B testing, analytics tools, and heatmaps, you can gain valuable insights into ad performance and make data-driven decisions. Implementing best practices for targeting, design, and optimization will help you maximize the impact of your pop under ads and achieve your advertising goals.